Your website’s structure is crucial to its success, and creating a seamless user experience will boost your chances of getting a conversion. But how can you know if what you’re doing is working? Easy, analyze the following 5 usability metrics and get a better understanding of your user’s behavior.
It doesn’t matter how good your site looks if users are landing and bouncing in five seconds flat. What’s the point of spending X amount of money developing your website if all your visitor leave without converting? Exactly. What you need are deliverable results that produce conversions. And for deliverable results, you need a website with good user experience (UX) that leaves a lasting impression.
In the online world, lasting impressions are all about how your users interact with your brand. You want to make them happy. You want them to have a good time on your site. More than that, you want them to have a satisfying experience that keeps them coming back for more. Why? Because a satisfying experience for them means more money for you.
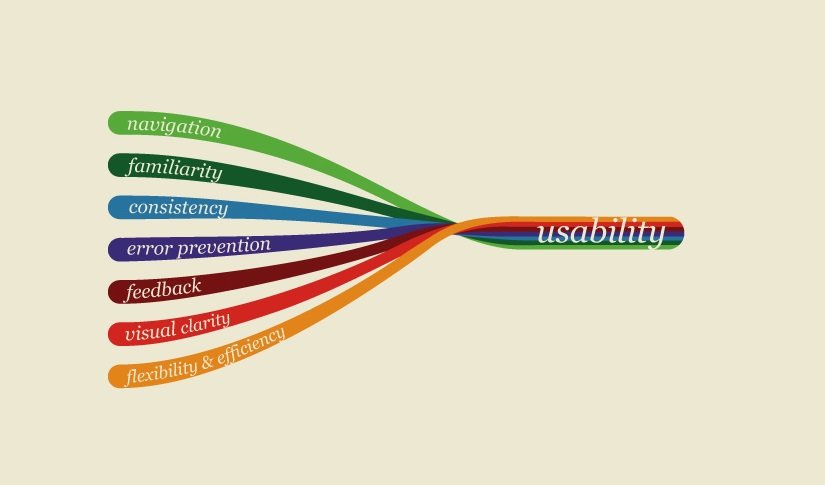
UX is also about usability. And as this post explains, “Usability is the intersection between effectiveness, efficiency and satisfaction in a context of use.”
This means that for optimal usability (and UX), you have to create a satisfying experience that’s both effective and efficient. Lucky for you, Google can help you out with Google Analytics. With analytics, you can track all sorts of metrics like load time, session length, bounce rate, navigation and page views, that’ll give you an idea of what your users think of your brand. You’ll be able to analyze their behavior, which will open an avenue for optimization you can take to improve their experience on your site.
Load Time
If you thought children were the epitome of impatience, then you’ve never encountered an online shopper. No, compared to internet users who have to wait four whole seconds for a page to load, children are downright angelic. Can you blame them though? Most people browsing online today are mobile users who’ve become accustomed to lightening-fast speed, and a delay throws a wrench in their timely plans for the day.
With this in mind, it’s no wonder that a slow load time messes with your user’s experience on your site. In other words, slow speed equals poor UX, especially if it’s their first impression with your brand. And when they have a poor experience on your site, they’re less likely to convert.
And it’s not just your users, Google has also made it clear that site speed — and page speed — is used in their algorithms to rank pages. To improve your site’s speed and, consequently, your bottom line, make use of the below suggestions:
- Enable compression to reduce the size of your CSS, HTML and JavaScript files
- Minify CSS, JavaScript and HTML
- Reduce redirects
- Leverage browser caching
- Optimize images
- Etc.
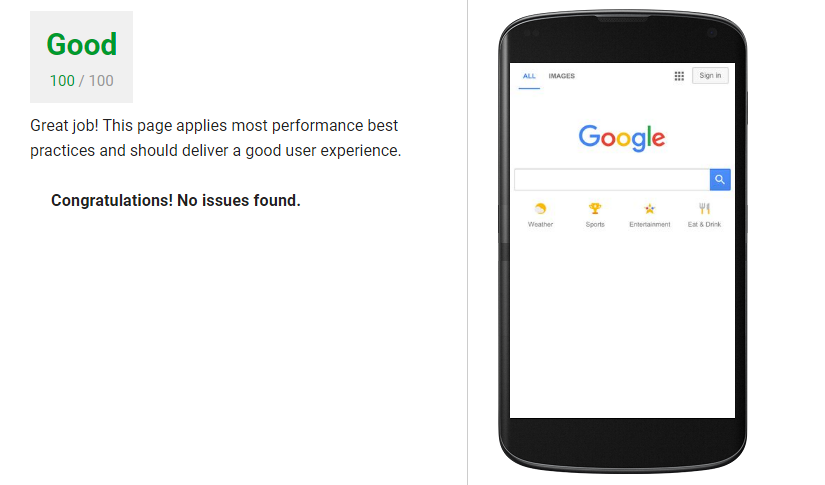
Once you optimize your site’s speed, check how it’s performing with Google’s PageSpeed Insights tool. Not only is it completely free, but it also tracks performance for both desktops and mobile devices. A quick rundown, it provides a score that ranges from 0-100 points, and gives you a rating that falls into three categories:
- Good: Page is performing great and delivers good UX
- Needs work: Page is missing some performance optimization that may result in poor UX
- Poor: Page is not optimized and is likely to deliver poor UX
Session Length
With fast load times you can ensure that your users will stay on-site…to a certain extent. Sure, they won’t leave because it’s taking too long to load a page, but what if they arrive and don’t find what they’re looking for? Inevitably, they will bounce. That’s not what you want. Instead, you want to understand their behavior. You want to know exactly why they stayed for 1 minute or 5 minutes, and why they converted or did not convert.
First up, track session lengths with Google Analytics or similar analytics services. If there’s a disparity between lengths, you may have to get rid of dead ends and make sure that your landing pages aren’t misleading. Otherwise, your users won’t trust your brand and will be less likely to convert. For example, if you advertise that you sell Y but when they land on your page they see Z, their trust in you will diminish and they’ll probably have a short session. Counter this by using analytics to see which pages are garnering short session lengths, and then go in and optimize them with proper CTAs and overall appropriate content.
Bounce Rate
From load time and session length we arrive at bounce rate, AKA the percentage or number of site visitors who land on your page only to leave (bounce) without exploring further. When you have a website, your goals are usually to convert visitors or for them to perform a desirable action that will lead to a conversion down the line.
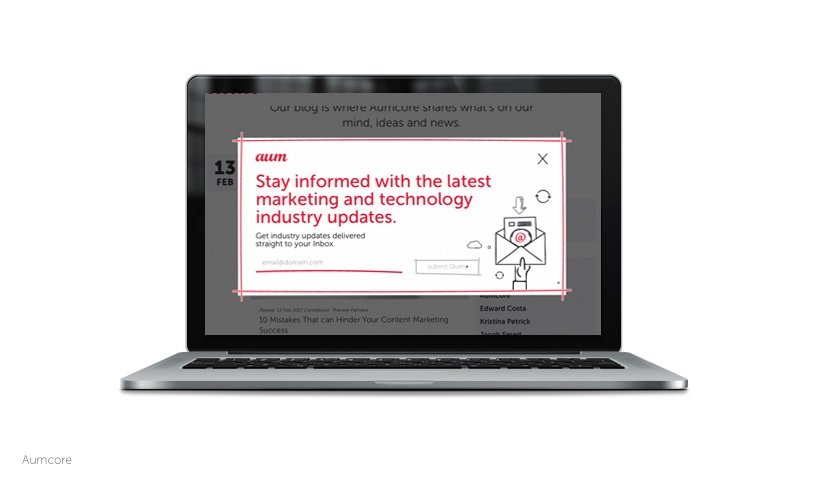
Before we move forward, keep in mind that you can’t determine how much time someone spent on your site if they don’t visit another page on your site. As such, you have to remember that just because someone bounced, they may not have necessarily bounced. That is to say that you may, for example, have an email signup CTA on your landing page. A visitor may arrive on your site, sign up for future emails, and at a later date may come back for the conversion. In scenarios such as these, the user may have bounced, but their time on the site still served a purpose.
If, on the other hand, you have an abnormally high bounce rate, then there may be an issue you want to fix. Similar to the section above on session lengths, high bounce rates may be due to a loss of translation between your site and your visitors, in which they arrive expecting something and leave because they get something else. To better understand if the bounce was beneficial or not, feel free to use this guide as a helper in adjusting your bounce rate in Google Analytics.
Navigation
It may be intuitive, but always make sure that your site is easily navigable and creates a seamless experience for all users. It doesn’t matter if doing otherwise looks better, once a user encounters a problem or an annoyance, they’ll become frustrated and click out. The thing is, you have to understand that website structure is crucial for success, and a functional experience that makes it clear what’s what on a page and where someone will be taken if they click something will improve UX.
Consequently, you have to use your site’s analytics to understand how your users are navigating through your site — their journey. You’ll find out where they go once they land on your homepage, what they’re clicking on, and most importantly, what’s working and what’s not.
Page Views
And now we arrive at page views, which is tied to navigation. Page views, also called sessions, show you how your users flow through your site. You want to make it easy for them to arrive at where they need to go to convert, and so you have to ensure that all pages on your site serve a purpose. The fact is that if your users have to do maneuver through your site in a roundabout way just to convert, they’ll likely become confused, frustrated or annoyed.
Don’t do this. Look through your analytics and, like stated above, make sure that every page a user visits on his journey serves a purpose. Even if the flow makes sense to you, they may not like it and, as we all know, the customer is always right.
Metrics Roundup
Too busy with no time for the full read? No problem, here are the usability metrics we covered today that you should be analyzing to study user behavior on your site:
- Load Time
- Session Length
- Bounce Rate
- Navigation
- Page Views
Guest Author
 Matthew is a content writer for Aumcore, a digital marketing agency based in NYC with a specialty in mobile user experience design services. He writes on a variety of topics that range from SEO to mobile app development.